Doing more with less
ARS SEA IACUC workshop, July 18, 2024
Who is this talk for?

- Practicing animal researchers without a strong statistics background
- I’ll throw some ideas out there that might pique your curiosity
- Use as a jumping-off point to learn more
Going beyond power analysis
- You might remember me boring you with a talk on power analysis from last year
- Power analysis is what you have to do to follow the rules, but it doesn’t encourage creative thinking
- We can breathe new life into old methods and really elevate our research technique with these new ways of doing things (that actually aren’t that new)

Reproducibility crisis
- In many scientific fields there is concern about reproducibility
- Gold standard: conducting the same study in multiple laboratories
- If the effect is real, it will be detected under different experimental conditions
- But this is often not feasible in practice

Blocks in experimental design

- Within a laboratory, we can maximize statistical power by using a blocked experimental design
- Example: cages, rooms, plots
- Usually blocks are physically separated from one another in space
A potential solution: “Mini-experiment” design
- We can make the blocks more independent of each other by blocking in both time and space
- This mimics a multi-laboratory study because conditions change more between the time points, than they would if all blocks were run at the same time
- Introducing environmental heterogeneity can increases realism
- If the effect is detectable across a wider range of environmental conditions, it may indicate a more general pattern

Drawbacks of mini-experiment approach
- May be more costly because it is less efficient to set up the experimental setup multiple times over a long period
- Slows down the all-important time to publication

2. Bayesian statistics

Bayesian vs. frequentist probability

- Probability, in the Bayesian interpretation, includes how uncertain our knowledge of an event is
- Example Before the 2016 Olympics, saying “The probability that Usain Bolt will win the gold medal in the men’s 100 meter dash is 75%.”
- In frequentist analysis, one single event does not have a probability. Either Bolt wins or Bolt loses
- In frequentist analysis, probability is a long-run frequency
- We could predict if the 2016 men’s 100m final was repeated many times Bolt would win 75% of them
- But Bayesian probability sees the single event as an uncertain outcome, given our imperfect knowledge
- Calculating Bayesian probability = giving a number to a belief that best reflects the state of your knowledge
Prior knowledge

- How exactly do you incorporate your prior judgment about the probability of an event when using Bayesian inference?
- Example I flip a coin and hide it from you and bet you $1 I flipped heads
- What is the probability it is heads?
Prior knowledge: example

- But what if you happen to know that I watch YouTube videos about how to manipulate the outcome of coin flips?
Bayes in the world of stats

- In the world of stat modeling, the prior is our best estimate of the distribution of the parameters of the statistical model before we get the data
- The likelihood is proportional to the probability of the distribution of the parameters based only on the data
- The posterior is our new best estimate of the distribution of the parameters of the statistical model, which has information from the prior and the data
The more data you get, the less important the prior
- The likelihood, which comes only from the data, “pulls” the posterior towards it
- The more data, the stronger it pulls

Frequentist approach may needlessly waste animals
- Frequentist statistics forces you to pretend you know nothing about the world before you collect the data
- This is a fine way to proceed, I use frequentist models all the time and I have no problem with them in general
- But it can lead to needless waste of animals: you need more data from each individual experiment if you are not allowed to use a reasonable amount of prior knowledge about the world

Bayes and decision-making
- Bayesian inference (ideally) does not use a black-and-white decision rule about whether there “is an effect” or not
- Frequentist tests usually have the goal of rejecting a null hypothesis, such as “There is no difference between the mean of A and the mean of B.”
- In Bayes world, instead of testing a null hypothesis, we estimate the size of the effect and the uncertainty around that effect
- That may be more relevant for decision-making
- Example: If you want to approve a new drug or therapy, the size of the effect is more relevant than whether the confidence interval includes zero or any other magic number
- We know the effect isn’t zero, we want to estimate if it’s big or small!

Side note: the history of Bayes, Part I
- Bayesian statistics is not new
- It was just called “statistics” before frequentist statistics were invented!
- The basic principles were developed hundreds of years ago
- Thomas Bayes, 1763
- Pierre-Simon Laplace, 1774


The history of Bayes, Part II
- Computers weren’t powerful enough to fit Bayesian stat models
- In the 1920s, R.A. Fisher solved that problem by nearly single-handedly inventing frequentist statistics
- But he disagreed with the Bayesian interpretation of probability … so he went on a campaign to discredit Bayesian methods

But where do I get information for my priors?
- Like estimating effect sizes in power analysis, there is an easy way and a hard way
- Fallback option is to use a conservative “uninformative” prior
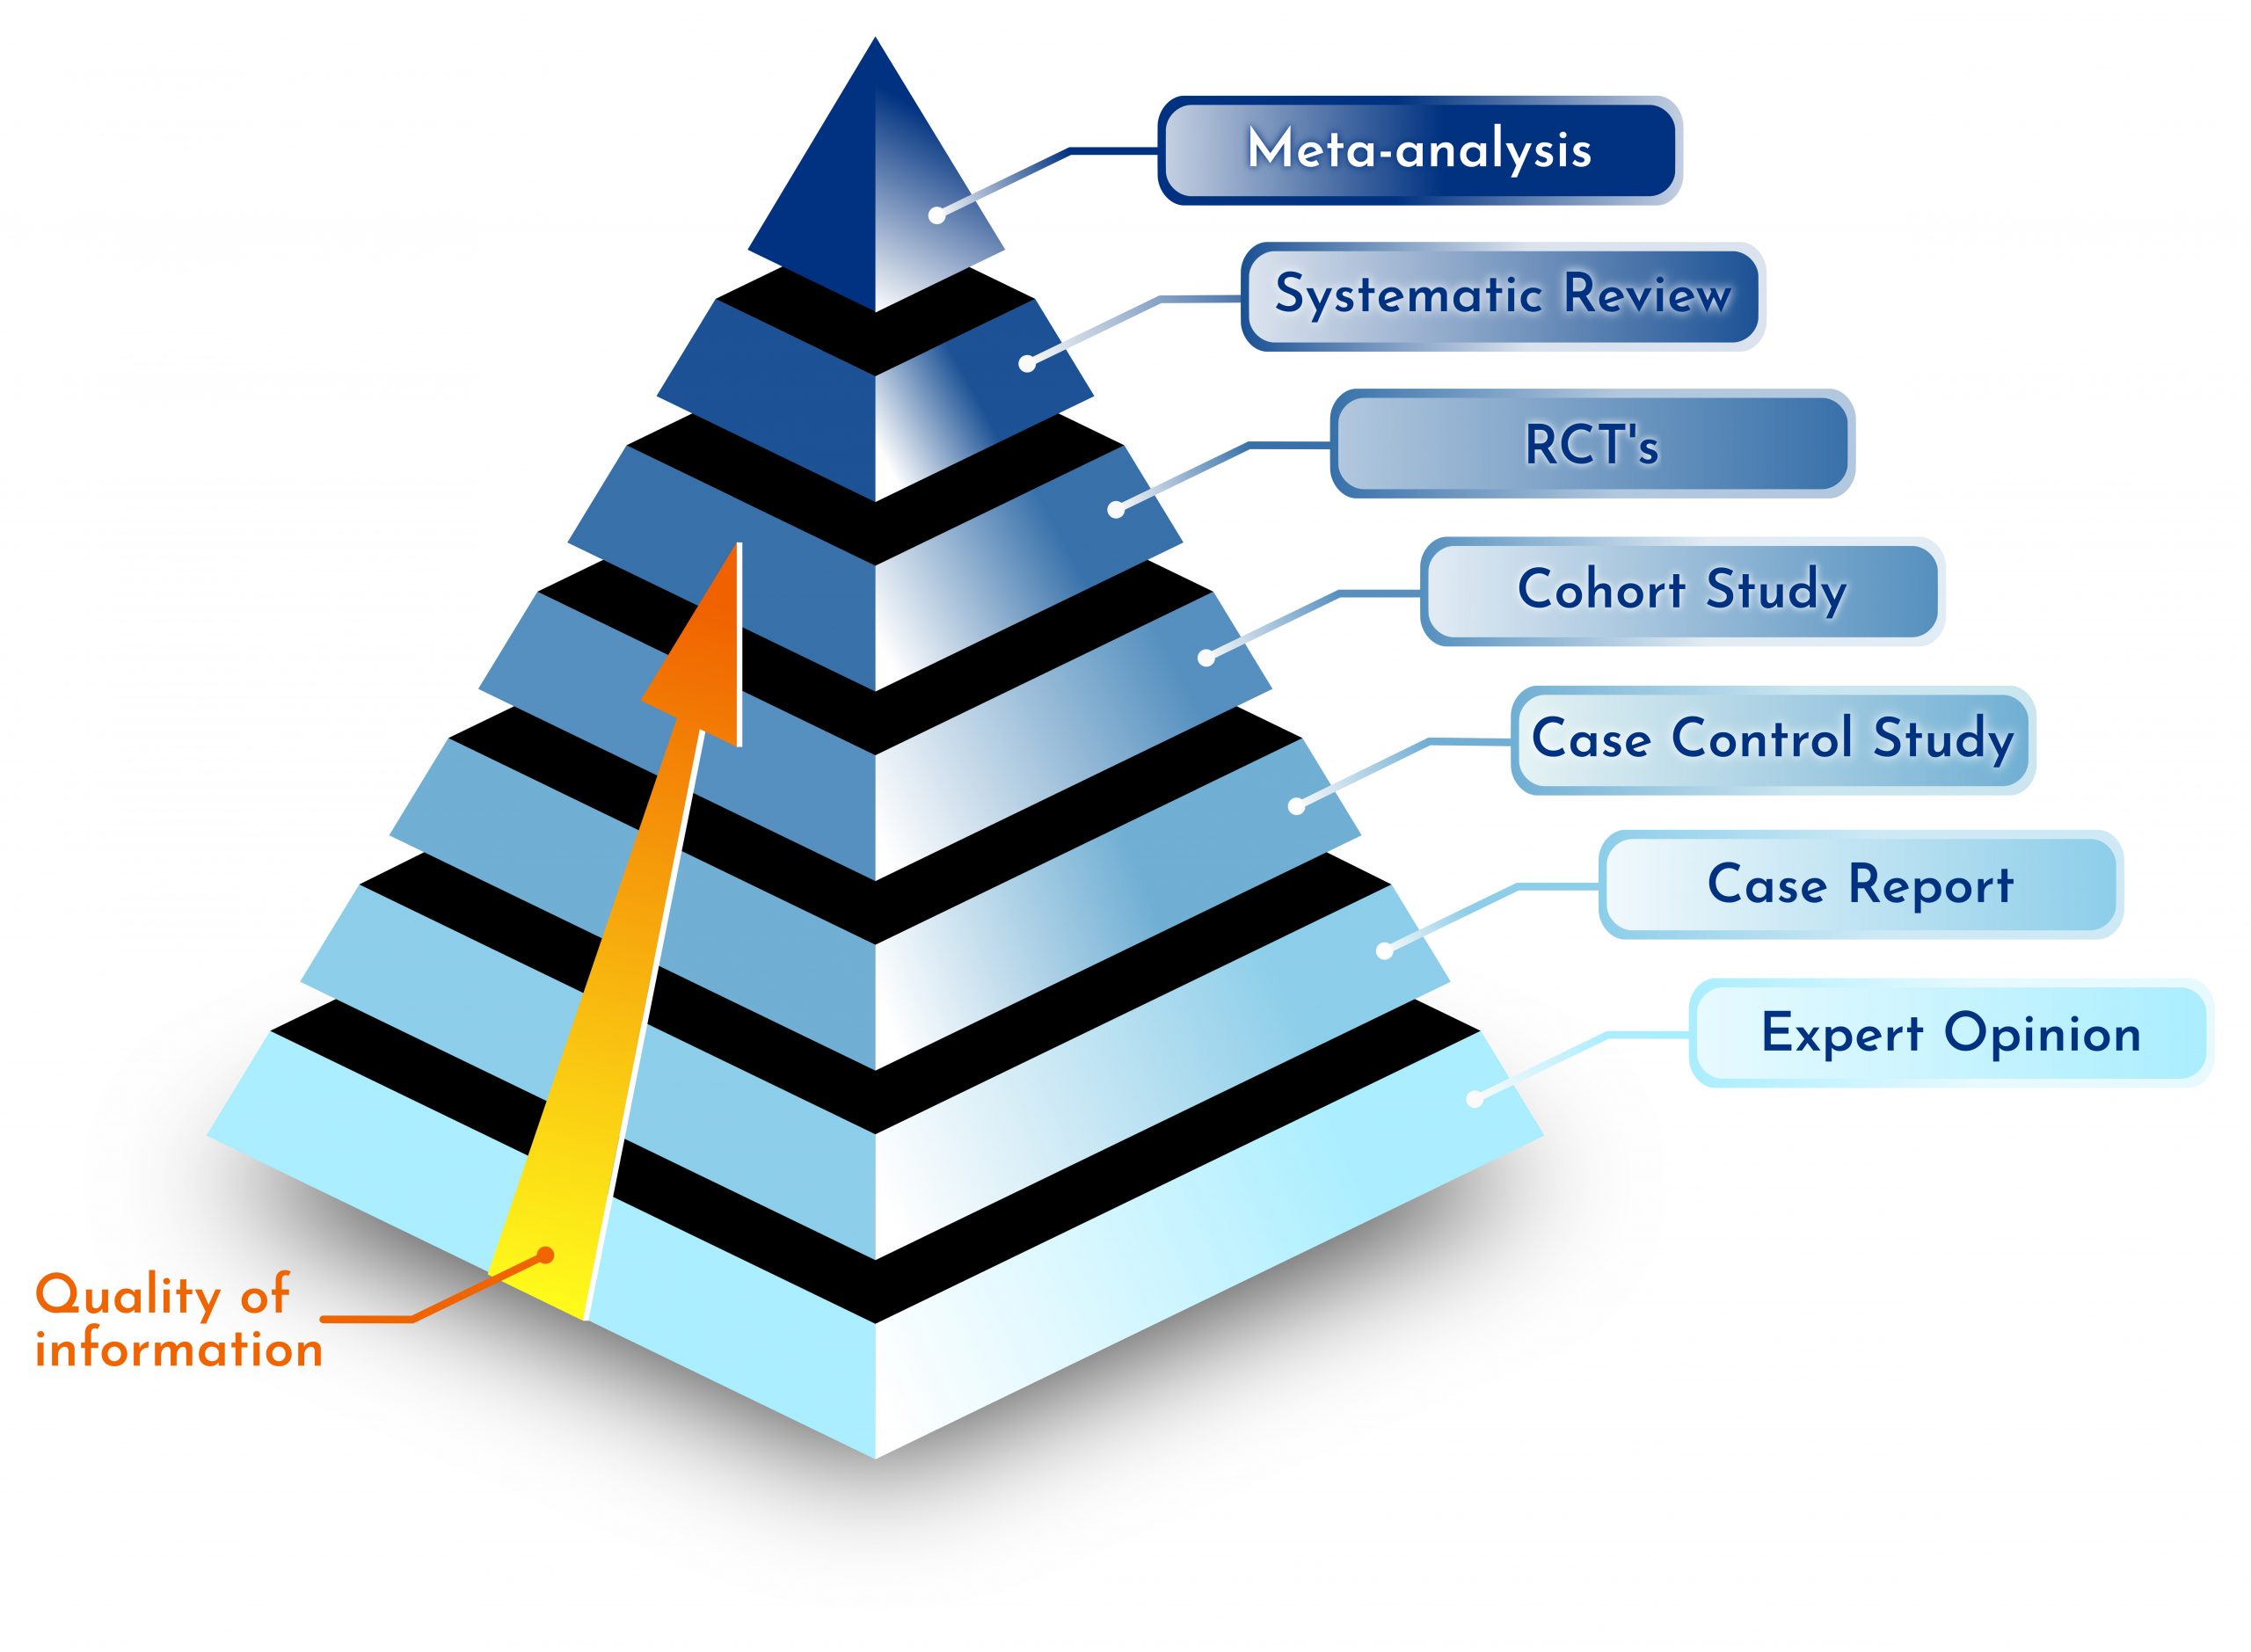
- You can get informed priors from the literature, especially meta-analyses, or previous studies in similar systems
- Common sense is allowed too!
- “Weakly informative” priors can constrain our estimates to a reasonable value
- A sensitivity analysis is good

Case study: von Kortzfleisch et al. 2020
- A battery of behavioral and physiological assays done on four mouse strains
- Conventional design: four experimental runs were done on four different days, each with a randomized complete block design
- 3 blocks with 9 mice from each strain in each block
- Mini-experiment design: same design as conventional, except that the three blocks for each run were done on a different day, for a total of 12 different days

Re-analysis of data from study
- I reanalyzed the data from this experiment (thanks to the authors for providing the raw data!)
- Original study used classical frequentist analysis but I used a Bayesian analysis
- Analyzed the conventional data and mini-experiment data in separate analyses
- Used priors indicating I have no prior belief about which strain has a higher mean than any other
Uninformative prior: \(\text{Normal}(0, 5)\)

Reanalysis of data from study
- Also analyzed the conventional data and mini-experiment data in separate sequential analyses
- One run at a time analyzed
- Used the posterior estimates of the mean and standard deviation of each strain as the priors for the next run

Splitting up the design in time improves the precision of estimates
- Credible intervals are narrower around the mini-experiment means compared to the control means
- Even though the distribution of the raw data is visually very similar between the two


Precision improves with each run in the sequential analysis
- When we split up the analysis and do it sequentially, we get steadily improving precision as more data is added


Wrap-up: practical recommendations

- Talk to me before you conduct your experiment and we can come up with creative ways to get the best inference out of the fewest animals
- Talk to me about using Bayesian analysis and about where you can find information for priors
- Organizations like IACUC that require pre-registered statistical analysis methods and power analysis are now open to Bayesian
- Power analysis can be done with Bayesian methods, too
Further reading/Sources
Mini-experiment design
- Richter, S. H. (2024). Challenging current scientific practice: How a shift in research methodology could reduce animal use. Lab Animal, 53(1), 9–12. https://doi.org/10.1038/s41684-023-01308-9
- von Kortzfleisch, V. T., Karp, N. A., Palme, R., Kaiser, S., Sachser, N., & Richter, S. H. (2020). Improving reproducibility in animal research by splitting the study population into several ‘mini-experiments.’ Scientific Reports, 10(1), 16579. https://doi.org/10.1038/s41598-020-73503-4
Bayesian statistics
